The Fort Worth region is experiencing an increase in home inventory in time for the spring buying and selling season. Looking at Q1, Tarrant County has the tightest inventory at 3.2 months, up 0.6 months year over year; Johnson County has 4.8 months of inventory, up 0.7 months year over year; and Parker County has the most balanced home buying and selling market with 5.4 months of inventory, up 0.4 months year over year.
Fort Worth’s active listings went up 24.7% to 3,006 homes on the market for the quarter, which indicates more sellers are entering the market. Fort Worth’s median home price remained stable at $330,000, increasing only 1.5% compared to Q1 2024, marking a move toward a more balanced market. The number of days a home is on the market in Fort Worth has ticked up 11 days year over year to 94.
“We are poised for an active spring housing market,” GFWAR President Paul Epperley said. “We are not experiencing the major jumps in prices as we have in years past, which, along with additional inventory, allows for more potential home buyers to enter the market. As we see the market level out, the dream of homeownership is within grasp for more area residents.”
Other cities within the region that are experiencing similar Q1 year-over-year trends include:
- Aledo
- Active listings: Up 10% to 33
- Months of inventory: 4.2
- Median price: $484,000, down 13.6%
- Days on the market: 95
- Burleson
- Active listings: Up 9.1% to 229
- Months of inventory: 3.8
- Median price: $355,000, up 6.9%
- Days on the market: 114
- Granbury
- Active listings: Up 49.3%
- Months of inventory: 6.7
- Median price: $498,000, up 19.4%
- Days on the market: 78
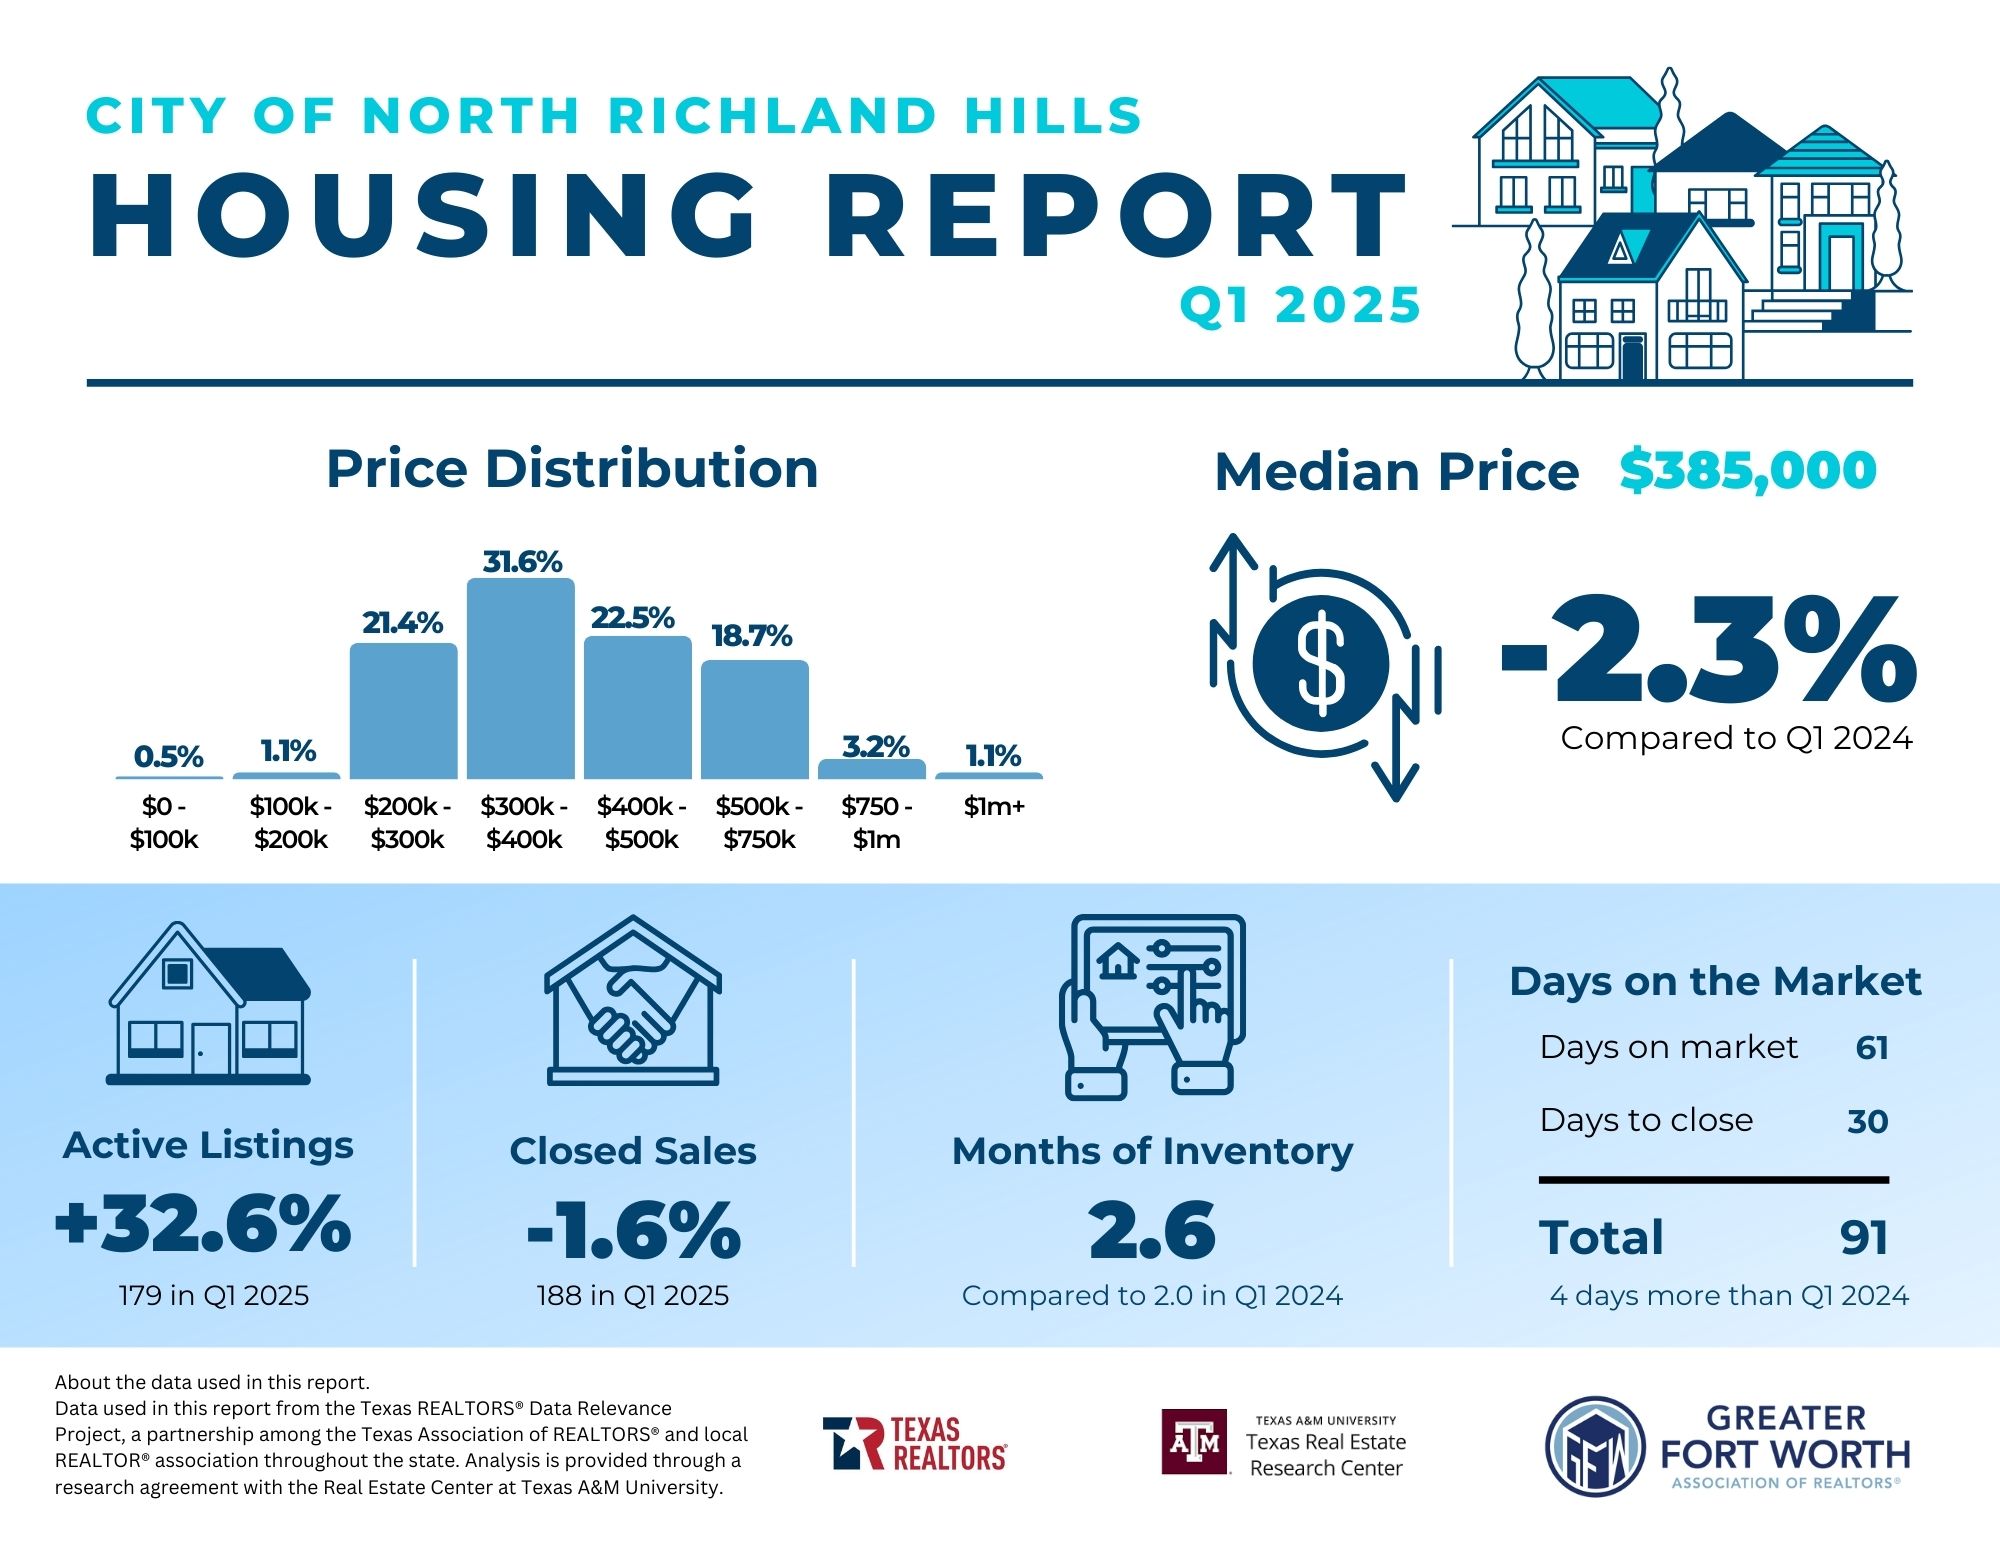
- North Richland Hills
- Active listings: Up 32.6%
- Months of inventory: 2.6
- Median price: $385,000, down 2.3%
- Days on the market: 91
- Weatherford
- Active listings: Down 18.1%
- Months of inventory: 3.6
- Median price: $310,000, down 3.1%
- Days on the market: 112
Tarrant County continues to have a competitive seller’s market. The county experienced a 25% increase in active listings, totaling 5,967 in Q1 2025. The demand for homes remains strong throughout the county with only 3.2 months of inventory, but the median home price is holding steady at $345,000, up 1.4%.
Parker County saw a 16.4% increase in active listings, totaling 1,357 in Q1 2025, which indicates an increased interest in the area. The housing market is balancing out with 5.4 months of inventory and the median home price slipping 6.2% to $432,900, potentially due to more affordable listings coming on the market.
Johnson County saw a 26.9% increase in active listings in Q1 2025, totaling 1,231, indicating a strong demand for homes in the area. The county’s inventory has increased overall to 4.8 months, and the median home price has risen slightly to $358,995, a 2.9% increase.
2025 Fort Worth Statistics at a Glance
- 2,245 - Homes sold in Q1 2025, 1.8% less than Q1 2024
- $330,000 – Median price in Q1 2025, 1.5% more than Q1 2024
- 3.4 – Monthly housing inventory in Q1 2025, compared to 2.7 months in Q1 2024
- 94 – Average number of days homes spent on the market in Q1 2025, 11 days more than Q1 2024
- 31 – Average number of days to close in Q1 2025
Q1 2025 Tarrant Co. Statistics at a Glance
- 5,967 - Homes sold in Q1 2025, 25% more than Q1 2024
- $345,000 – Median price in Q1 2025, 1.4% more than Q1 2024
- 3.2 – Monthly housing inventory in Q1 2025, compared to 2.6 months in Q1 2024
- 93 – Average number of days homes spent on the market in Q1 2025, 10 days more than Q1 2024
- 30 – Average number of days to close in Q1 2025
Q1 2025 Median Home Prices at a Glance
- Fort Worth: $330,000
- Johnson County: $358,995
- Parker County: $432,900
- Tarrant County: $345,000
-